Do you have your own website or maintain the website of the company you work for? Of course, to do this right, you need to keep a keen eye on the performance of your website. Google offers several tools to collect and analyze data of your website. You probably have heard of Google Analytics and Google Search Console before. These tools are free to use for everyone maintaining a website and can give you very valuable insights about your website. Here we’ll explain how to use Google Search Console for SEO!
Why everyone with a website should use Google Search Console
Google Search Console has been created to easily track the performance of your website. You can get valuable insights out of your Google Search Console account which means that you can see what part of your website needs work. This can be a technical part of your website, such as an increasing number of crawl errors that need to be fixed. This can also be giving a specific keyword more attention because the rankings or impressions are decreasing.
Besides seeing this kind of data, you’ll get mail notifications when new errors are noticed by Google Search Console. Because of these notifications, you’re quickly aware of issues you need to fix. That’s why everyone with a website should learn how to use it!
Setting up an account
To start using Google Search Console, you’ll need to create an account. Within the new Google Search Console, you can click on ‘add a new property’ in the top bar.
Clicking on the ‘Add a property’ button, you can insert the website you want to add. If you choose the new Domain option, you only need to add the domain name — so without www or subdomains. This option tracks everything connected to that domain. With the ‘old’ URL prefix option you have to add the right URL, so with ‘https’ if you have an https website and with or without ‘www’. For collecting the right data, it’s important to add the right version.
When you’ve added a website, you need to verify that you’re the owner. There are several options to verify your ownership. The Domain option only works with DNS verification, while the URL prefix supports different methods. You can find out more about the differences in Google’s documentation: adding a new property and verifying your site ownership.
Features in Google Search Console
Now you’ve set up your account what would be the next step? Well, it’s time to look at some of your data! We’ll explore some of the reports and information available in the rest of this article.
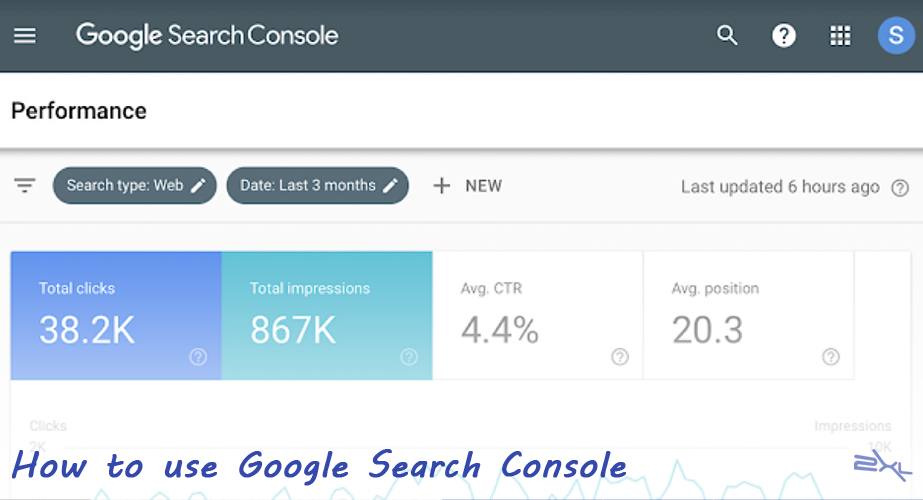
Performance tab
Within the Performance tab, you can see what pages and what keywords your website ranks for in Google. In the old version of GSC you could see the data of a maximum of the last 90 days but in the current version, it’s possible to see the data up to 16 months. Keep in mind that the data is available from the moment you set up your account.
If you check the performance tab regularly, you can quickly see what keywords or what pages need some more attention and optimization. So where to begin? Within the performance tab, you see a list of ‘queries’, ‘pages’, ‘countries’ or ‘devices’. With ‘search appearance’ you can check how your rich results are doing in search. Each of those sections can be sorted by the number of ‘clicks’, ‘impressions’, ‘average CTR’ or ‘average position’.
1. Clicks
The amount of clicks tells you how often people clicked on your website in the search results of Google. This number can tell something about the performance of your page titles and meta descriptions: if just a few people click on your result, your result might not stand out in the search results. It could be helpful to check what other results are displayed around you to see what can be optimized for your snippet.
The position of the search result also has an impact on the number of clicks of course. If your page is in the top 3 of Google’s first result page it will automatically get more clicks than a page that ranks on the second page of the search results.
2. Impressions
The impressions tell you how often your website in general or how often a specific page is shown in the search results. The number of impressions shown after this keyword shows how often our website is shown for that keyword in the search results of Google. You don’t know yet what page ranks for that keyword.
To see what pages might rank for the specific keyword, you can click on the line of the keyword. Doing this for the keyword, the keyword is added as a filter.
After that, you could navigate to the ‘Pages’ tab to see what pages exactly rank for this keyword. Are those pages the ones you’d want to rank for that keyword? If not, you might need to optimize the page you’d like to rank. Think of writing better content containing the keyword on that page, adding internal links from relevant pages or posts to the page, making the page load faster, etc.
3. Average CTR
The CTR – Click-through rate – tells you what percentage of the people that have seen your website in the search results also clicked through to your website. You probably understand that higher rankings mostly also lead to higher click-through rates.
However, there are also things you can do yourself to increase the CTR. For example, you could rewrite your meta description and page title to make it more appealing. When the title and description of your site stands out from the other results, more people will probably click on your result and your CTR will increase. Keep in mind that this will not have a big impact if you’re not ranking on the first page yet. You might need to try other things first to improve your ranking.
4. Average position
The last one in this list is the ‘Average position’. This tells you what the average ranking of a specific keyword or page was in the time period you’ve selected. Of course, this position isn’t always reliable since more and more people seem to get different search results. Google seems to understand better and better which results fit best for which visitor. However, this indicator still gives you an idea if the clicks, impressions and the average CTR are explainable.
Index coverage
A more technical but very valuable tab within Google Search Console is the ‘Index coverage’ tab. This section shows how many pages are in the index of Google since the last update, how many pages aren’t and what errors and warnings caused difficulties for Google indexing your pages properly.
We recommend checking this tab regularly to see what errors and warnings appear on your website. However, you also get notifications when Google has found new errors. When you get such a notification you can check the error in more detail here.
You may find that errors are caused when, e.g., a redirect doesn’t seem to work correctly, or Google is finding broken code or error pages in your theme.
Clicking on the link, you can analyze the error more in depth to see what specific URLs are affected. When you’ve fixed the error you can mark it as fixed to make sure Google will test the URL again.
There are a few things you should always look for when checking out your coverage reports:
1. If you’re writing new content, your indexed pages should be a steadily increasing number. This tells you two things: Google can index your site and you keep your site ‘alive’ by adding content.
2. Watch out for sudden drops! This might mean that Google is having trouble accessing (all of) your website. Something may be blocking Google; whether it’s robots.txt changes or a server that’s down: you need to look into it!
3. Sudden (and unexpected) spikes in the graph might mean an issue with duplicate content (such as both www and non-www, wrong canonicals, etc.), automatically generated pages, or even hacks.
We recommend that you monitor these types of situations closely and resolve errors quickly, as too many errors could send a signal of low quality (bad maintenance) to Google.
URL Inspection
The URL Inspection tool helps you analyze specific URLs. You retrieve the page from Google’s index and compare it with the page as it lives now on your site to see if there are differences. On this page, you can also find more technical info, like when and how Google crawled it and how it looked when it was crawled. Sometimes, you’ll also notice a number of errors. This might be in regards to Google not being able to crawl your page properly. It also gives information about the structured data found on this URL.
Enhancement tabs
Below the ‘Index coverage,’ you can find the Enhancement tab. Here, you’ll find everything you need to improve how your site performs. It has insights in site speed, mobile usability, AMP usage, and structured data enhancements that might lead to rich results in the SERPs.
Speed
The new speed report is still in its experimental stages, but already an invaluable addition. This report gives a good idea of how fast your site loads on mobile and desktop. In addition, it also shows which pages have issues that keep them from loading quickly. The data is based on the Chrome UX report, so real data of real users. Site speed is a difficult topic containing many moving part, so it’s good to learn how you should think about site speed.
AMP
One of the tabs is for all things ‘AMP’. AMP stands for Accelerated Mobile Pages: lightning fast mobile pages. If you’ve set up AMP for your website you can check for errors in Google Search Console. Within this section you can see the valid AMP pages, the valid ones with warnings and errors.
Below the chart, the issues are listed. If you click on one of the issues, you can see the affected URLs. Just as in the index section of GSC you can validate your fix if you’ve fixed an issue.
Rich results enhancement tab
If you have structured data on your site, it’s a good idea to check out the Enhancements reports in Search Console. The Enhancements tab is the place where all the insights and improvements that could lead to rich results are collected. There’s an ever-expanding list of support rich results. As of writing, that list contains:
breadcrumbs
events
faqs
how-tos
jobs
logos
products
reviews
sitelinks searchboxes
videos
All these tabs show how many valid enhancements you have, or how many have errors or warnings. You get details about the kind of errors and warnings and on which URLs these are found. There’s also a trend line that shows if the number of issues is increasing or decreasing. And that’s just the start of it.
The Enhancements reports help you find and fix issues that hinder your performance in search. By checking the issues, reading the support documentation and validating fixes, you can increase your chance of getting rich results in search.
Sitemaps
An XML sitemap is like a roadmap to all important pages and posts on your website. We think every website would benefit from having one.
Within the XML sitemap tab of Google Search Console you can tell Google where your XML sitemap is located on your site.
We recommend everyone entering the URL of their XML sitemap into GSC to make Google find it easily. In addition to that, you can quickly see if your sitemap gives errors or if some pages aren’t indexed, for instance. Checking this regularly, you’re sure Google can find and read your XML sitemap correctly.
We recommend regularly checking the XML sitemap section in our plugin to manage which post types or taxonomies you’re including in your sitemaps!
Links
Within the links to your site section, you can see how many links from other sites are pointing to your website. Besides, you can see what websites link, how many links those websites contain to your site and lastly, what anchor texts are used most linking to your website. This can be valuable information because links still are very important for SEO.
Within the internal links section, you can check what pages of your website are most linked from other spots on your site. This list can be valuable to analyze regularly because you want your most important pages and posts to get most internal links. Doing this, you make sure Google understands as well what your cornerstones are.
Mobile usability
The mobile usability tab within this section shows you usability issues with your mobile website or with specific mobile pages. Since mobile traffic is rising all over the world, we recommend checking this regularly. If your mobile site isn’t user-friendly, lots of visitors will leave it quickly.
Manual Actions
The manual actions tab is the one you don’t want to see anything in. If your site is penalized by Google, you’ll get more information in here. If your site is affected by a manual action, you’ll also get messaged via email.
There are a number of scenarios which can lead to these kinds of penalties, including:
You have unnatural/bought links
Make sure from and to your site are valuable, not just for SEO. Preferably your links come from and link to related content that is valuable for your readers.
Your site has been hacked
A message stating your site’s probably hacked by a third party. Google might label your site as compromised or lower your rankings.
You’re hiding something from Google
If you’re ‘cloaking’ (that is, intentionally showing different to content than to users, for the purposes of decieving either of them), or using ‘sneaky’ redirects (e.g., hiding affiliate URLs), then you’re violating of Google’s Webmaster Guidelines.
Plain Spam
Automatically generated content, scraped content and aggressive cloaking could cause Google to blacklist your site.
Spammy structured markup
If you use rich snippets for too many irrelevant elements on a page, or mark up content that is hidden to the visitor, that might be considered spammy. Mark up what’s necessary, and not everything is necessary.
Security issues
Last but not least: within the security issues tab you’ll get a notification when your website seems to have a security issue.